Month in Review as at August 2023
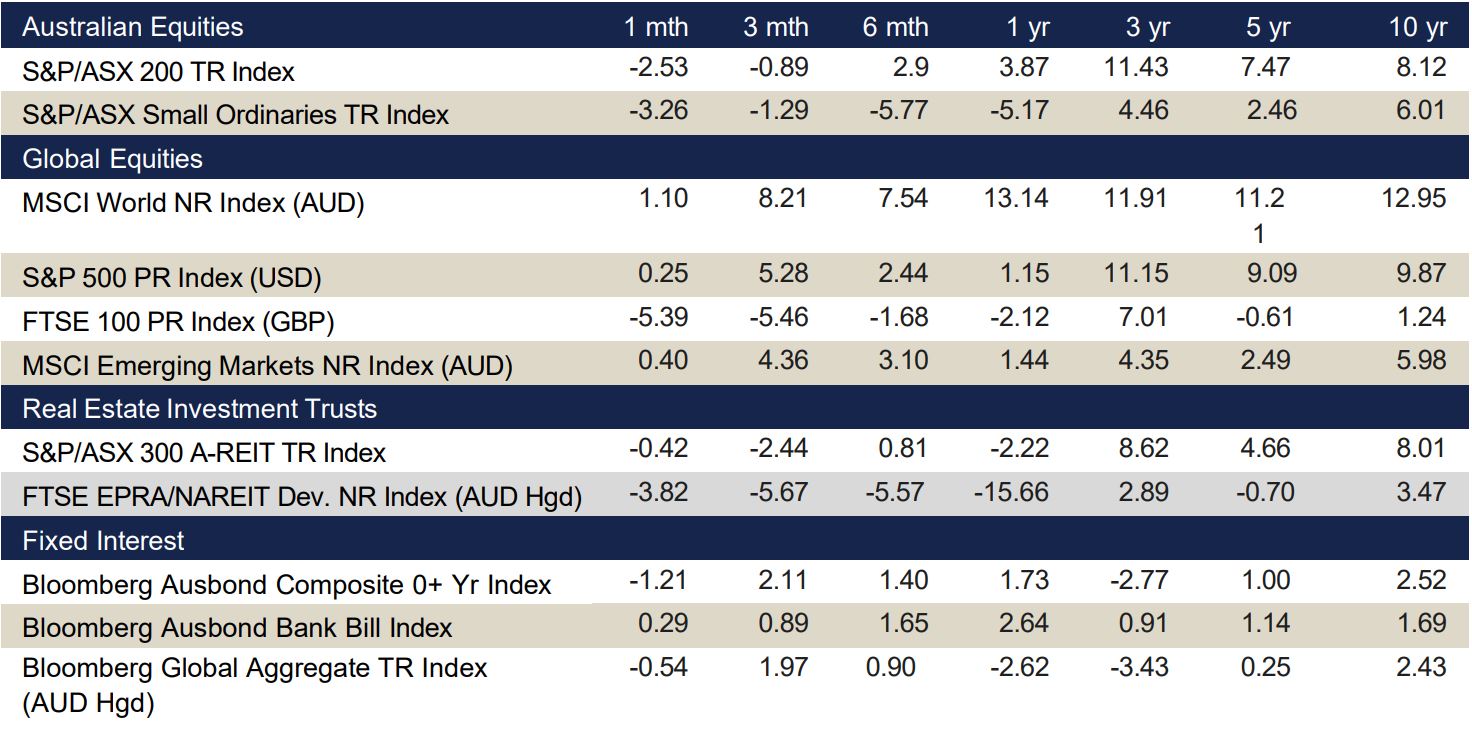
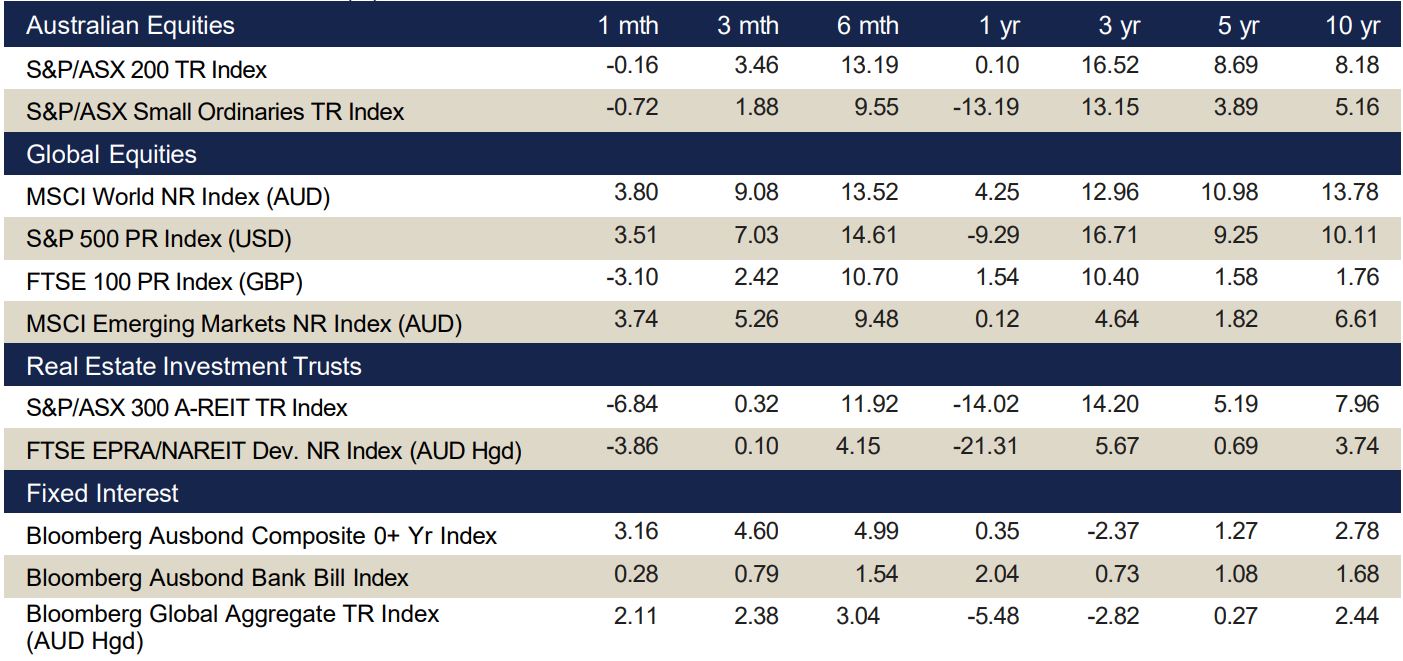
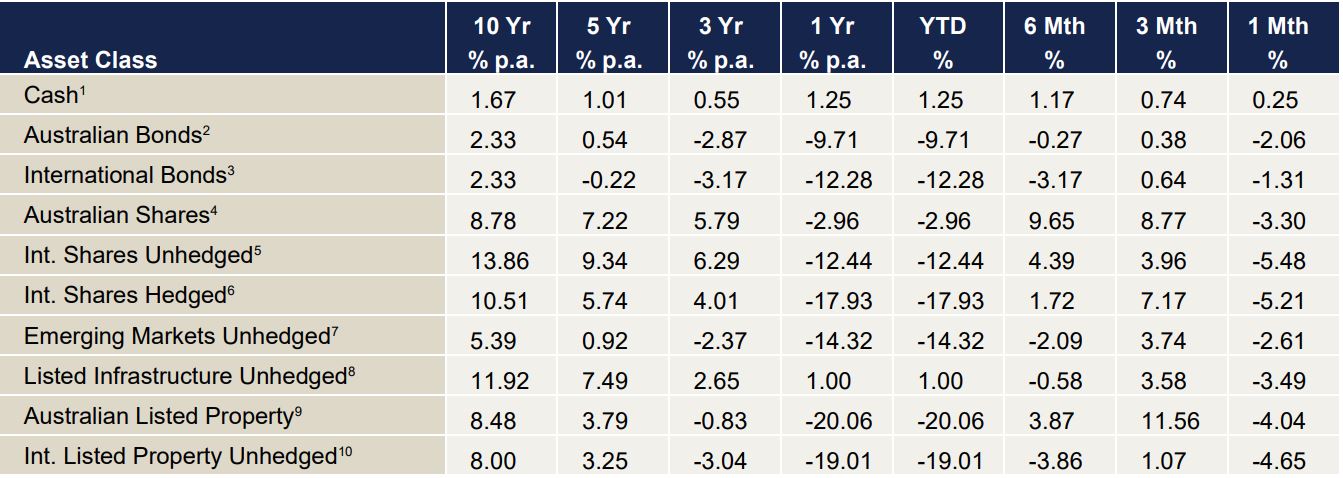
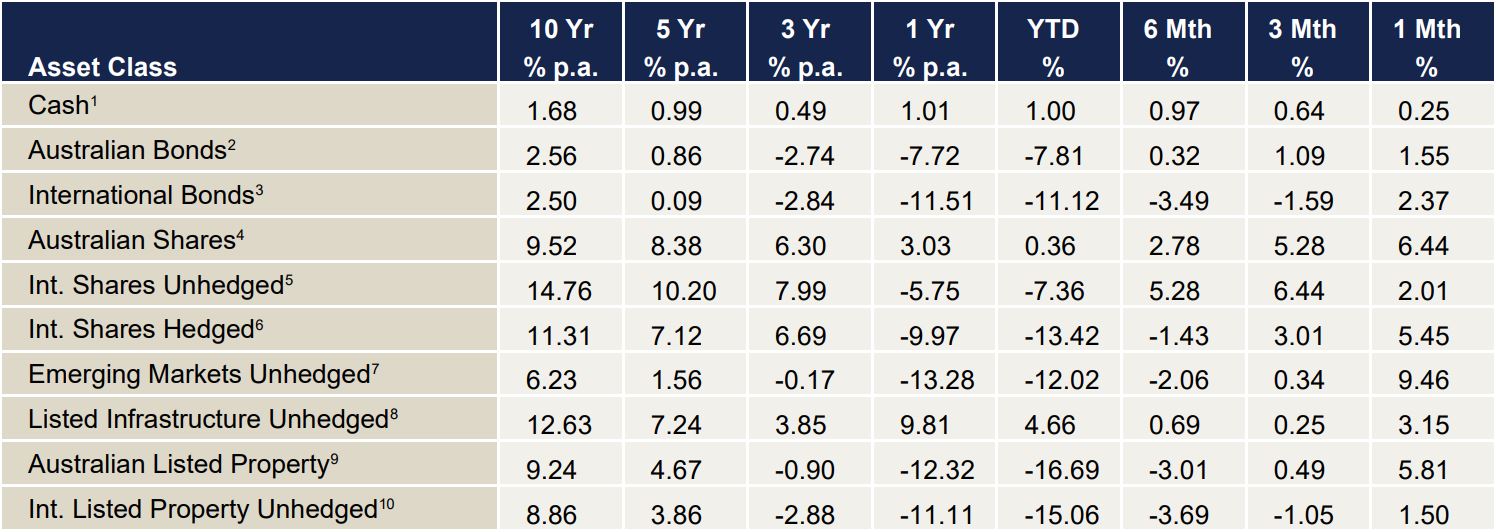
VIEW PDFIndex returns at end August 2023 (%)
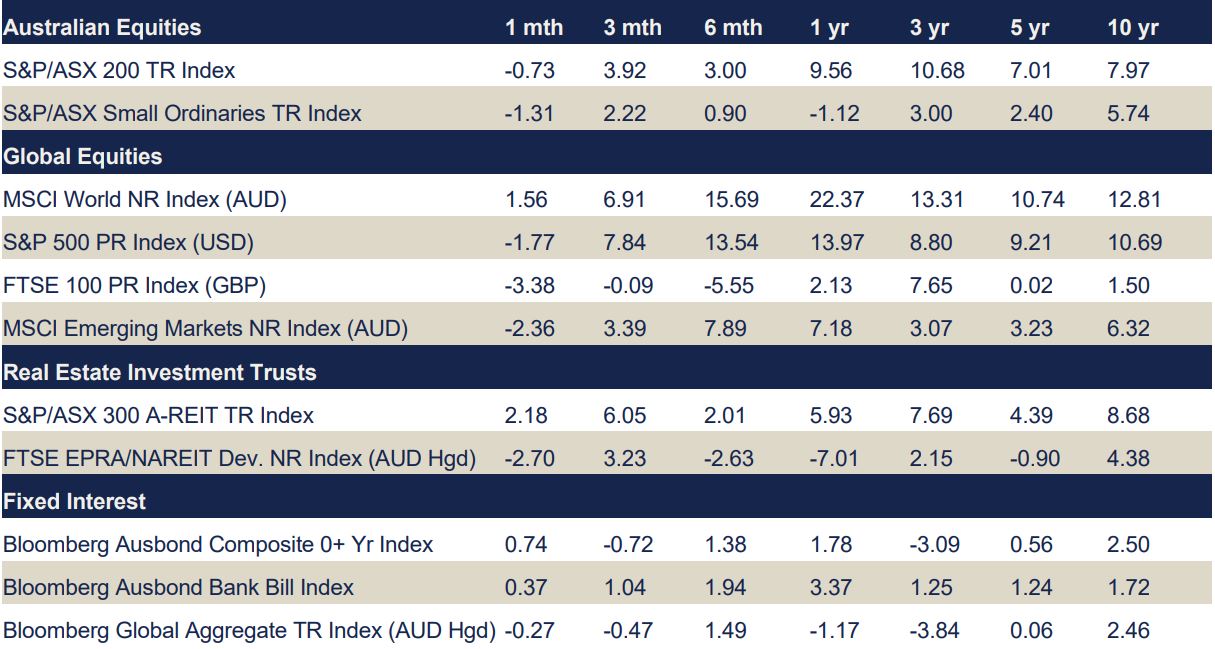
Data source: Bloomberg & Financial Express. Returns greater than one year are annualised.
Commentary regarding equity indices below references performance without including the effects of currency (unless specifically stated).
Key Points
- During August, the Australian equity market declined by 0.7%. Most sectors finished the month lower, except for Consumer Discretionary (+5.7%), Property (+2.3%) and Energy (0.5%).
- Overseas markets also declined, with Asian markets in particular finishing the month substantially softer.
- The Hang Seng Index (HKD) and the CSI 300 Index (CNY) declined by 8.2% and 6.0% respectively.
- While most equity markets have generated moderate to strong returns over the one-year period, the Asian indices are outliers with declines of 4.4% and 5.3%.
Australian equities
The S&P/ASX 200 Accumulation Index fell 0.7% in August, as earnings results dampened market returns. Of the 11 sectors, only Consumer Discretionary (+5.7%), Property (+2.3%) and Energy (+0.5%) had positive returns for the month, while Utilities (-3.9%) and Consumer Staples (-3.2%) were the biggest drags on the Index.
Share prices battled with a combination of mixed earnings results and a conservative outlook for companies, while soft economic data out of China continued to weigh on local investors.
Consumer Discretionary was the standout performer for the month, benefiting from resilient consumers. Given the continued strain on households through a higher cost-of-living, many companies in the sector had flagged headwinds in the months leading into reporting season, with a conservative outlook already baked into share prices. Another theme to emerge from earnings reports is the ability for companies to manage cost pressures, particularly those brought about through higher financing rates. Despite revenue growth, Consumer Staples reported disappointing profit results, leading to their waning share prices. More broadly, the sustained impact of a slowing Chinese economy was seen across the market, particularly Materials.
The month saw all Factors perform negatively. Enhanced Value (-3.1%) and Low Volatility (-2.5%) were the worst performing factors, while Growth was able to limit its losses (-0.4%).
Global equities
Primarily negative economic data in August resulted in a rise in bond yields and a decrease in equity markets. With renewed investor concerns, US equities stumbled with the S&P500 Index declining -1.6% (in local currency terms) during the month.
Most sectors across Europe fell, with the DAX 30 Index returning -3.0% (in local currency terms) for the month. Energy was one of the sole positive contributors, inflation has remained stable but is yet to decline below previous months’ levels. The European Central Bank’s next meeting will be a watchpoint for investors.
China experienced some of the sharpest declines for the month with a potentially challenged real estate sector. Investor concerns around stimulus deployment largely contributed to this decline, with the CSI 300 Index returning -6.0% for the month (in local currency terms). In Hong Kong, stocks fell sharply with weaker manufacturing and real estate market concerns in surrounding markets. This was reflected in the Hang Seng Index returning -8.2% for the month (in local currency terms).
Property
The S&P/ASX 200 A-REIT Accumulation Index finished +2.3% higher in the month of August as the A-REIT sector continued its consolidation in recent months. In contrast, the Global Real Estate Equities market (represented by the FTSE EPRA/NAREIT Developed Ex Australia Index (AUD Hedged) finished lower (-2.7%). The Australian Infrastructure sector (as represented by the S&P/ASX Infrastructure Index) finished -2.8% lower.
In the month of August, M&A activity was relatively muted as companies reported their full year results. Abacus Group (ASX: ABG) officially completed its de-stapling from Abacus Storage King (ASX: ASK). Ingenia Communities Group (ASX: INA) extended their development partnership with Sun Communities for an additional seven years. Meanwhile, Goodman Group (ASX: GMG) reported that Senko Co Ltd. signed a major lease agreement at their Goodman Joso location in Japan. The Australian residential property market experienced an increase by +0.1% Month on Month (as represented by CoreLogic’s five capital city aggregate). Brisbane was the biggest riser (+1.5%), followed by Adelaide (+1.1%). Over the one-year period, Perth was the largest gainer (+4.5%). In contrast, Hobart (-0.1%) was the only city to deliver negative returns in the month of August. Similarly, Hobart has the lowest percentage change year on year (-10.0%).
Fixed Income
In their August meeting, the Reserve Bank of Australia have for the second time elected to pause rate hikes and leave the target cash rate at 4.10%, citing slowing economic growth and pressure on household budgets. The Australian bond market reacted mildly, with Australian 2- and 10- Year Bond yields falling 23bps and 3bps respectively over the course of the month.
The Australian yield curve continued to flatten throughout August, and the Bloomberg AusBond Bank Bill Index returned 0.37%. Markets are expecting a similar story in September, with the RBA expected to hold rates steady next month. RBA Governor Philip Lowe’s tenure will soon end, and the position will be headed by his deputy Michele Bullock.
In the US, the Federal Funds Rate remains at 5.25%- 5.50% following the most recent July rate hike, with the Fed’s first-rate cut being priced into futures contracts by March 2024. The Bloomberg Barclays Global Aggregate Index (AUD) returned 2.62% over the month, and US 2- and 10-Year Treasury yields rose 1bp and 15bps respectively. In the UK, the interest rate is at 5.25% after the BoE hiked by 25bps in their August 2 meeting, resulting in UK Gilt yields rising over the month.
Key economic points
- Australia’s GDP for 2Q23 was 4%, with annual GDP at 2.1%.
- The RBA maintained the cash rate at 1%, while reiterating that inflation is still too high.
- Growth was tepid globally with 2Q23 GDP below (Eurozone) or matching (USA) 1Q23 figures.
Australia
Australian GDP came in slightly above expectations, increasing at an annual rate of +2.1% for the 12 months to June, despite very weak household consumption.
GDP growth has slowed from +2.4% to March, consistent with the RBA’s forecast for a continued softening of the domestic economy into the end of this calendar year before a gradual recovery through 2024 and 2025.
The RBA left the cash rate at 4.1% in August, reiterating that inflation was still too high and further tightening may be needed to bring inflation back to its target range of 2-3%. Inflation unexpectedly eased down to 4.9% in July, led by falling prices for fresh produce and fuel.
Westpac-Melbourne Institute Index of Consumer Sentiment came in at 81.0 in August, ahead of expectations of 80.7 with the RBA’s decision to hold rates steady for a second month in a row, doing little to quell worries about higher borrowing costs. The unemployment rate rose to 3.7% in July, above the expected 3.6% and underscoring the RBAs prediction that the labour market is near a turning point. Retail sales increased by 0.5% in July, topping market estimates of 0.3%, while annual sales rose 2.1%.
The composite PMI edged down to 48 in August, with services activity falling at a faster pace than manufacturing output. The NAB business confidence index rose to 2 in July with wholesale, construction and recreation & personal services accounting for most of the upswing.The trade surplus narrowed to $8.04 billion in July, below market forecasts of $10 billion.
Global
Record temperatures in August drove food prices higher with soybeans, olive oil and rice just three of the products affected by shortages and price hikes. While seasonal price fluctuations are usual, the exceptionally hot and dry summer experienced in the northern hemisphere has caused poor harvests and many crops to fail.
The war in Ukraine also continues to impact the global food supplies, as the UN brokered deal for safe passage of Ukrainian grains via the Black Sea collapsed, with Russia pulling out of the agreement. While some grain is still being exported via inland rivers, it takes longer and is more expensive than via sea.
US
The US economy grew at an annualized rate of 2.1% in 2Q23, ahead of the first quarter’s expansion of 2.0%. Annual inflation rose to 3.2% in July, just shy of the expected 3.3%.
The US economy added 187,000 jobs in August, more than market expectations of 170,000. This is the third month of sub 200,000 jobs growth and coupled with the increase in unemployment to 3.8%, suggests that the year of successive rate rises by the Fed is working to get inflation under control and avert a recession.
Consumers remain tentative about the outlook ahead with consumer sentiment falling from 71.6 in July to 69.5 in August. Retail sales in July increased 0.7%, beating the 0.4% forecast, with the annual rate increasing 3.2%. The S&P Global Composite PMI fell to 50.4 in August, with services activity weak and the contraction in manufacturing deepening.
The trade deficit widened less than expected to US$65 billion in July, from a downwardly revised US$63.7 billion in June, with China accounting for US$24 billion of this figure.
Euro zone
The Eurozone economy grew by 0.6% in 2Q23, easing from a 1.1% expansion in the previous period, due to the large drop in real incomes and surging interest rates.
Annual inflation remained steady at 5.3% in August, above the expectations of 5.1%. Unemployment stayed at the record low of 6.4% for July, matching the market forecast.
Consumer confidence dropped to -16 in August, as households were more pessimistic about both their own and the wider economic outlook.
Retail sales dropped 0.2% in July, below market expectations of – 0.1%, with the annual rate down 1.0%, ahead of the anticipated -1.2%.
The Composite PMI dropped to 46.7 in August, with the biggest contraction in services activity since November 2020. PPI dropped 0.5% in July, broadly in line with expectations, with the annual rate falling 7.6%. This can be attributed to the decrease in energy prices.
UK
The Bank of England increased the cash rate by 25bps to 5.25% in August, the 14th consecutive rise. The Bank came under renewed pressure to raise interest rates again in September after wages jumped more than expected in June, boosted by a one-off payment to NHS workers.
Annual inflation slowed to 6.8% in July, matching market expectations, mainly due to a sharp fall in fuel prices. This was mirrored in the annual PPI which fell be 0.8% in July, below the market expectations.
The unemployment rate increased to 4.2% in June and above market expectations of 4.0%.
Consumer confidence rose to -25 in July as easing inflation reduced pressure on household spending sentiment. Retail sales fell 1.2% in July 2023, worse than market forecasts of a 0.5% fall, as sales declined for both food and non-food, reflecting the impact of wet weather and cost pressures. Annual sales fell 3.2%, compared to the expected -2.1%.
The composite PMI index fell to 48.6 in August with both services and manufacturing activity declining.
China
In China, the unemployment rate rose to 5.3% in July, up from June’s 16 month low of 5.2%.
Annual Retail sales grew 2.5% in July, down from 3.1% in June and falling short of expectations. Both consumer and business confidence are flagging as the post pandemic recovery has stalled and many believe that policymakers have fewer good options to fight the downturn than in the past.
The Caixin/S&P Global Services PMI fell from 54.1 in July to 51.8 for August, the lowest reading since pandemic lockdowns in late 2022. The Composite PMI declined to 51.7, adding to the recent series of negative signals for the country’s future demand for Australian mining commodities.
China lifted anti-dumping tariffs on Australian barley in a move that points to improving bilateral relations and would alleviate supply concerns after Russia suspended a humanitarian corridor used to deliver key Ukrainian grains to global markets.
Japan
Japan’s 2Q23 GDP was slightly below expectations, coming in at 1.3% for the quarter, which may give further justification for the BOJ to relax its monetary stimulus.
The annual inflation rate was unchanged at 3.3% in July, notably higher than the market forecast of 2.5%.
The unemployment rate rose unexpectedly to 2.7% in July, defying market forecasts of no change from 2.5% in June.
The consumer confidence index dropped to 36.2 in August, below forecasts of 37.5. Retail sales rose 2.1% in July, with the annual rate rising 6.8%, exceeding forecasts.
The composite PMI came in at 52.6 in August with the fastest rise in services activity in three months offset by weakness in manufacturing production.
Currencies
The Australian dollar (AUD) continued to descend over the month of August, closing -1.1% lower in trade weighted terms to 60.6, depreciating against all four referenced currencies in this update.
Volatility over the course of the month continued to be primarily influenced by weaker economic indicators from China, further eroding investor conviction in China’s growth trajectory. In addition, relative US dollar strength predominantly stemming from the appreciation of the USD/CNY mid-month added additional drag to the AUD.
Relative to the AUD, the US dollar (USD) led the pack in August, appreciating by 3.8%. Conversely, the Japanese Yen (JPY) was the laggard of the month, albeit appreciating in relative terms by 1.5% against the AUD. Year-on-year, the AUD remains behind the Pound Sterling (GBP), Euro (EUR) and USD by -13.4%, -12.5% and -5.6% respectively, and has now fallen behind the JPY by -1.0%.