All Posts By

admin

Workplace well-being makes good business sense

It has been a year like no other. When it comes time to doing your annual business review, however formal or informal that may be, think about the well-being of your team. How has your team come through the year?

Leaders play a crucial role in creating thriving workplaces, no matter the size of the team. And more and more information is coming to hand that investing in workplace mental health makes sound business sense.

Productivity Commission on Mental Health

A couple of weeks ago, the Productivity Commission released its long-awaited report on mental health. Unlike other many reports on the topic, this one used an economic lens to investigate mental health impacts. In doing so the Commission estimates the total combined cost to the Australian economy of mental ill-health is around $220b each year.1

The report identified the importance of building mentally healthy workplaces and enabling people to participate in and thrive at work. The Commission made a number of recommendations relating to embedding psychological health and safety in workplaces, assisting employers to meet their duty of care, ensuring minimum standards for employee assistance programs and creating better workers compensation schemes.

The role of workplaces

So how much, or little, does your workplace do in relation to the mental well-being of team members?

According to one study by Beyond Blue, 91% of employees believe workplace mental health is important but only 52% believe their own workplace is mentally healthy.2

Creating a thriving workplace is not just good for your people – data shows that every $1 spent can provide a $2.30 return by way of factors like increased productivity and reduced absenteeism.3 This means that efforts to improve employee well-being may boost your bottom line too.

Here are a few points to consider.

Workplace Health and Safety

You may be aware of legislative requirements for the physical health and safety of employees, but the obligations extend to psychological safety too.

If your workplace has never conducted a psychosocial risk assessment, it may be something to consider. Safe Work Australia has a lot of information to help get you started.

Psychosocial work hazards increase the risk of stress and can impact an employee’s mental health. These factors include:

• Excessive job demands
• Low job control
• Workplace conflict or bullying
• Low role clarity
• Poor organisational change management and uncertainty
• Low recognition and reward
• Unfair work practices
• Lack of support
• Isolation
• Exposure to trauma

Checking in with your team

Sometimes a person may appear okay on the surface, but below the surface, it may be a different story. Everyone has a role to play in recognising potential warning signs. This can be as simple as asking someone how they are going. It can be awkward or uncomfortable to have these chats but there is a lot of information to guide you.

In fact, there is no shortage of workplace mental health training and resources available. Helpful resources include the workplace mental health hub, Heads Up, developed by Beyond Blue which includes a comprehensive ‘how-to guide’, and national mental health promotion foundation, Superfriend, who recently released their Indicators of a Thriving Workplace report.

No matter what state or region you live in, there is a stack of information at your disposal.

Burnout

One of the most observable trends to come out of COVID-19 is the tendency for people to overwork. The blurred lines between our work and personal lives is a big contributing factor. Alongside physical symptoms, burnout can have many other negative repercussions including reduced cognitive ability, increased stress, reduced productivity and it could even have a negative effect on team culture.

It’s worth noting that leaders have been under increased pressure as a result of COVID-19 with increased expectations and responsibilities falling on them. This also highlights the need for leaders to look after themselves and model good self-care in their own lives. To use an old analogy, leaders need to put their own oxygen mask on first before helping others!


1 https://www.pc.gov.au/inquiries/completed/mental-health#report
2 https://www.headsup.org.au/docs/default-source/resources/bl1270-report—tns-the-state-of-mental-health-in-australian-workplaces-hr.pdf?sfvrsn=8
3 Creating a Mentally Healthy Workplace, PwC and Beyond Blue 2014. https://www.headsup.org.au/docs/default-source/resources/beyondblue_workplaceroi_finalreport_may-2014.pdf

This information is current as at November 2020. This article is intended to provide general information only and has been prepared without taking into account any particular person’s objectives, financial situation or needs (‘circumstances’). Before acting on such information, you should consider its appropriateness, taking into account your circumstances and obtain your own independent financial, legal or tax advice. You should read the relevant Product Disclosure Statement (PDS) before making any decision about a product. While all care has been taken to ensure the information is accurate and reliable, to the maximum extent the law permits, ClearView and its related bodies corporate, or each of their directors, officers, employees, contractors or agents, will not assume liability to any person for any error or omission in this material however caused, nor be responsible for any loss or damage suffered, sustained or incurred by any person who either does, or omits to do, anything in reliance on the information contained herein.

Taking philanthropy to the next level

Taking philanthropy to the next level

Australians are generous when it comes to opening their wallet for a good cause. But you may have reached a point in life where you want to make a more substantial contribution with control over how your money is spent. You may also wish to get your children involved to instil shared values.

While it hasn’t received much publicity, increasing numbers of Australians are using charitable trusts to give in a more planned and tax-effective way.

The turning point came in 2001 when the Howard Government introduced the Private Ancillary Fund (PAF) with the aim of encouraging more individual and corporate philanthropy. PAFs are charitable trusts that can be used by an individual or family for strategic long-term giving.

Since then, the number of PAFs and the amount of money contained in them has grown steadily. In early 2018, JB Were reported that there were 1600 PAFs, housing $10 billion and distributing $500 million a year.i

Claiming a tax benefit

According to Philanthropy Australia, in the 2015-2016 financial year 14.9 million Australians collectively donated $12.5 billion to charities and not-for-profits (NFPs).ii The median donation was $200 and 4.51 million taxpayers claimed for a ‘deductible gift’ on their tax return, highlighting that you don’t have to be wealthy to live generously.

Though donations to appropriately accredited charities and not-for-profits are tax-deductible, the figures indicate two-thirds of taxpayers don’t bother to claim. It’s well worth keeping track of receipts so you can claim when you think that, for example, a single donation of $5000 to a charity or NFP in a financial year will reduce your taxable income by $5000.

A core principle of tax-deductible philanthropy is that the giver shouldn’t stand to receive any material benefit. For example, if you buy tickets in a raffle run by a charity you can’t claim a tax deduction on the cost of the tickets. In order to receive a tax deduction for your donation, the recipient must also be registered as a deductible gift recipient (DGR).

There are many ways to be charitable but the impact on your tax bill will vary depending on how you go about it.

A more sophisticated approach

These days, people who want to take philanthropy to the next level with an ongoing, tax-effective approach have a variety of trusts to choose from.

The Private Ancillary Fund

PAFs are the best-known of the new breed of trusts. The money placed in a PAF is tax-deductible and assets in the fund aren’t subject to income or capital gains tax (but do qualify for franking credits).

Let’s say a dentist sets up a PAF and gifts half his $500,000 annual income into the fund where it’s invested in a diversified portfolio. The dentist’s taxable income now drops to $250,000. What’s more, no tax is paid on the returns made on the $250,000 that has been invested in the PAF. The dentist has to distribute a minimum of five per cent of their PAF’s net asset value annually, or a minimum of $11,000. After meeting that requirement, the dentist has a relatively free hand about which charities to support and how much they receive.

The Public Ancillary Fund (PuAF)

PuAFs work the same way as PAFs but operate on a larger scale. For example, 10 dentists may set up a PuAF to finance the building of dental hospitals in Africa. As well as gifting part of their incomes, the 10 dentists can (in fact, are obliged to) invite the general public to make tax-deductible donations to their PuAF.

Testamentary Trust (or Will Trust)

These are used by individuals wanting to leave money in their will to a specified charitable purpose. The two advantages of this type of trust are that the trustee(s) can distribute the income generated by the trust in a way that minimises the tax burden of beneficiaries, and the assets in the trust can’t be accessed by parties such as creditors and the divorcing partners of a beneficiary.

Smart selflessness

Like many parts of the economy, the charity sector has been ‘disrupted’ in recent years, with a stronger focus on donor engagement.

Organisations such as Effective Philanthropy and Effective Altruism have emerged to analyse how the charity dollar can be best spent. While crowdfunding platforms such as GoFundMe have emerged to facilitate, for example, the funding of individual medical procedures.

As a result, many philanthropists have gone from simply writing cheques to directing – or at least monitoring – how their money is spent.

Your contribution is most likely to be well spent if you donate it to an organisation that defines its mission clearly, has measurable goals, can demonstrate concrete achievements and is transparent about its finances (e.g. has annual reports available on its website).

Few people give to get a tax deduction but by supporting good causes in a tax-effective manner you can achieve a bigger bang for your philanthropic buck. If you would like to know more about tax-effective giving, give us a call.

Some examples of philanthropists making their mark
James &
Gretel Packer
National Philanthropic Fund
(2014-)
$200 million to the arts and Indigenous education by 2024
Paul Ramsay Paul Ramsay Foundation
(2014-)
$3 billion to improve health and education outcomes for Australians
Andrew Forrest & his wife Nicola Minderoo Foundation
(2001-)
$645 million to drive social change encompassing education, research and Indigenous affairs
‘Pokies King’ Len Ainsworth ‘Giving Pledge’
(2017-)
$500 million to support primarily medical and health-related charities


Are you interested in creating a PAF to support your charity contributions, reach out to the Sherlock Wealth team to discuss your unique situation here


https://www.strategicgrants.com.au/au/free-resources/blog/19-blog-kate/280-grantseeking-donor-giving

ii http://www.philanthropy.org.au/tools-resources/fast-facts-and-stats/


When to start talking money with kids

When to start talking money with kids

Aussies may have a natural reserve when it comes to talking money. But as parents, teaching our kids to be financially aware and responsible takes more than a few quick lessons about money and the opportunities and pitfalls it can create.

Teaching opportunities will come and go as our children grow. If you’re a relaxed sort of money parent, then maybe you’re happy to freestyle and just take these chances as they come. But if you’re keen to create teaching moments by design, it can help to know what other people do and when are the best windows in your child’s development to introduce new financial concepts.

Make an early start

In 2018, 1000 Australian parents were surveyed about how they teach their kids about money for the Share the Dream report. Results show that half of parents are talking to their kids regularly about money and almost three-quarters of kids (72%) are getting pocket money, an important tool for teaching kids about saving and spending money. The age group most likely to be getting pocket money are 9-13-year-olds (80%) and if you’re aged 4-8 years you’re less likely to receive any (65%).

But according to a Cambridge University research study from 2013, parents could be missing a trick if they’re waiting until kids turn nine to start pocket money. Their findings suggest that by the age of seven, kids have already acquired the mindsets that will direct their money habits in adulthood. Not only that, but they’re also capable of grasping the fundamentals of how money works at this age. They understand that money can be exchanged for goods and that you need to earn it first.

Dr David Whitebread, the co-author of the study, encourages parents and educators to get on the front foot when it comes to helping kids learn good money habits early on. “The ‘habits of mind’ which influence the ways children approach complex problems and decisions, including financial ones, are largely determined in the first few years of life,” says Dr Whitebread. “Early experiences provided by parents, caregivers and teachers which support children in learning how to plan ahead, in being reflective in their thinking and in being able to regulate their emotions can make a huge difference in promoting beneficial financial behaviour.”

Make it holistic

As well as starting money lessons early, stats from the Share the Dream report also suggest that money talk from parents needs to be covering more ground. Many parents are definitely covering off the basics, with the majority of parents (52%) having talked with kids about spending and saving in the last six months. On the other hand, talking about cashless payments with kids is far less common. Only 19% of parents have spoken about online transactions in the same period, and the numbers discussing in-app purchases (13%) and Afterpay (5%) are smaller still.

The study also shows that there may be advantages to being more forthcoming about ‘invisible’ money transactions with our kids. Across all age groups 38% of parents are reporting that their kids have a preference for online purchases. For the teenagers in the 14-18 group, this figure rises to nearly half (47%). If kids are to be prepared for their online shopping experiences, it makes sense to be having these discussions as they begin to transact online.

Make it open and honest

Talking money with our kids can make us feel uncomfortable and this is a trend that was also revealed in the Share the Dream survey. 68% of parents sometimes feel reluctant to talk about money with their children and in the majority of cases (32%), it’s because they don’t want their kids to worry about it. And 19% of parents say they don’t feel good enough about their own financial situation to discuss it as a family.

While financial stresses can be very real to you, there may be a way for you to help your kids learn from your own ups and downs with money without causing them concern. In fact, the ‘Engager’ parent profile identified in our survey shows that having more family discussions about money can lead to their kids being more curious, confident and financially literate. Engagers are least reluctant to talk to their kids about money and it seems their honest approach is leading to more positive habits among their children, 56% of whom are likely to have a job, compared with the survey average of 44%.


Source: Money and Life. 

How women can build their financial literacy

How women can build their financial literacy

Recent studies show that more than two in five Australians lack confidence when it comes to financial decision making.

The Federal Government believes this is largely due to a lack of financial literacy within the community, which is why it has developed the National Financial Literacy strategy. This initiative aims to motivate Australians of all ages, genders and socioeconomic backgrounds to engage more with their finances. In turn, this will help people make informed financial decisions that will improve their economic wellbeing.

What does it mean for women?

As social norms and family structures have changed, financial decision-making is no longer the sole domain of the male breadwinner – these days it’s just as important for women to take charge. Yet women experience higher levels of stress when it comes to managing money, with more than a third saying they find it overwhelming.

That’s why it’s vital for women to build their financial literacy. Becoming more financially savvy can change a woman’s life, by empowering her to be self-sufficient and make confident decisions that will improve her financial situation. Currently, only 10% of Australian women retire with enough savings to fund a comfortable lifestyle – so by arming women with strategies to help close the ‘super gap’ at each life stage, they may become less reliant on social services in retirement.

How you can take control

The financial decisions women make throughout their lives can impact their financial position in later years. With this in mind, here are some things you can do to take control at each stage of your life journey.

Starting out

Generally speaking, the gender pay gap puts women on the back foot as soon as they enter the workforce. Although there may be greater equality between the sexes than ever before, women’s average salaries are still 17.3% lower than those of men doing the same job.

This highlights how important it is for women to be able to budget if they want to build their savings and get ahead.

Raising a family

Women are still more likely than men to take time out of the workforce to raise kids, which means they receive less in employer super contributions during their careers. This leads to a significant super gap – men have an average super balance of $292,500 when they retire compared to $138,150 for women.

That’s why you need to prepare carefully for your career breaks, and top up your super either before or after to make up any shortfalls. The Government’s Parental Leave Calculator and Career Break Super Calculator make it easier to plan your finances around having a family. Visit https://www.moneysmart.gov.au/tools-and-resources to access these calculators.

Paying off debts

If you’re like most women, the largest debt you’ll ever have to pay off is your home loan. Before taking the plunge into homeownership, a Mortgage Calculator can show you how much you can afford to borrow, so you can work out a repayment plan that fits your budget. And if you’re prone to splurging on your credit card, a Credit Card Calculator could help stop your debts from spiralling out of control. Visit https://www.moneysmart.gov.au/tools-and-resources to access these calculators.

Investing for the future

With lower confidence levels and a smaller appetite for risk in their investments, women are less likely than men to choose high-growth investments like shares. This also means they miss out on potentially higher returns. But as women generally retire earlier and live longer than men, they can expect to spend more time in retirement – which makes it even more important for them to have enough money to last the distance. As the first step, make sure your investment mix matches your life stage. That way your super and other investments will have the best chance of growing over time.

Your financial adviser can help

Because women face so many distinct challenges, they need customised solutions – which is where a licensed financial adviser comes in. If there’s ever an aspect of your finances that you’re unclear about, reach out to the Sherlock Wealth team to discuss your unique situation here. We can explain it in a way that makes sense to you, so you can make wiser financial decisions.

Source: AMP News & Insights.

Market Review October 2020

Monthly Market Review – October 2020
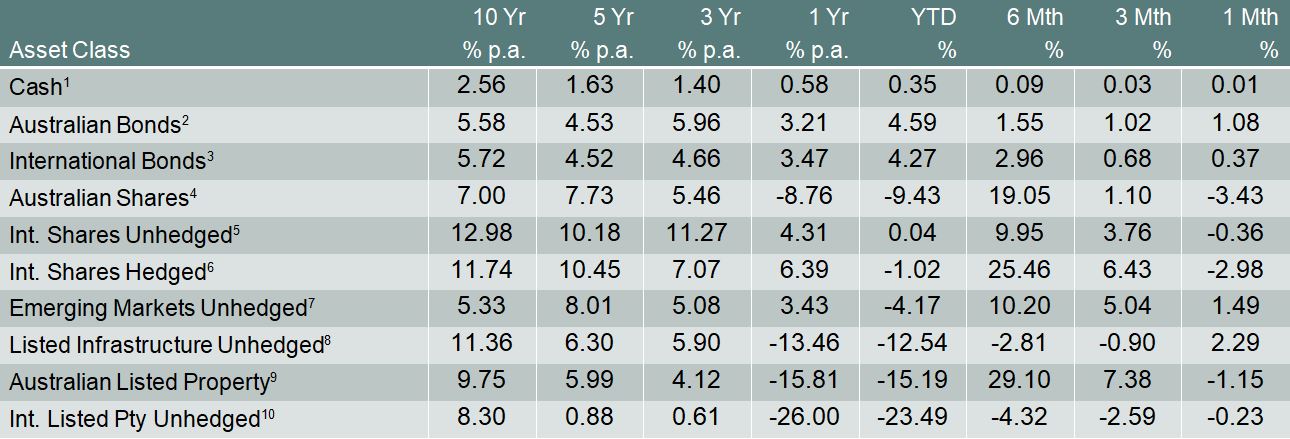
VIEW PDF

How the different asset classes have fared: (As at 31 October 2020)

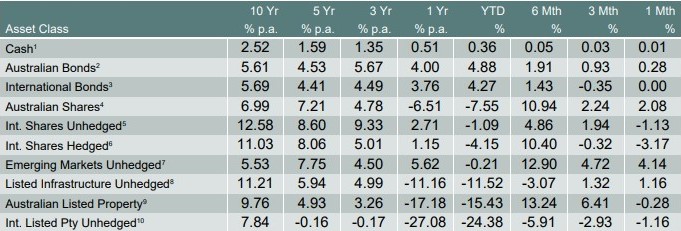
The Australian share market performed strongly over October with the S&P/ASX All Ordinaries returning 2.08%, as COVID-19 cases remained low. The end of October saw Victoria’s relaxing of its lockdown restrictions. Data in Australian remained mix. Just over 50% of the jobs and hours cut in April/May have recovered, the remainder is expected to take significantly longer to recover. While new home sales strengthened in September due to HomeBuilder and other incentives.

Global markets were highly volatile in October. Two topics dominated markets over October: rising COVID-19 cases across Europe and the US and the absence of a pre-election fiscal stimulus. October started off strongly as most major indices were up but due to the increasing uncertainties, European and US indices sold off late in the month, giving up all gains and ending negative.

The S&P 500 ended October down -2.7%, as the markets dealt with the rising number of cases in COVID-19, particularly in the mid-west together with the ambiguity regarding a clear presidential winner. European stocks suffered considerably, with the Euro Stoxx 50 down -7.4% for the month, as all major economies reported new highs in inflection rates. Governments across Europe have imposed varying levels of containment measures, which is expected to prevent any near-term recovery. Fortunately, even with higher infection rates, death rates have remained low across Europe and the US due to better testing and treatments.

Asia was the standout region, in particular, China. The MSCI China A International USD returned 3.5% in October, as economic activity in China rebounded strongly. Chinese exports strengthened in September, imports rebounded, and credit growth accelerated.

The two topics that dominated October headlines will continue to substantially impact global markets. The results of the November election will remain in focus, as the outcome will affect the level of fiscal stimulus. While the ability of developing governments to curb infection rates will affect their ability to have a swifter recovery.

Disclaimer

The information contained in this material is current as at date of publication unless otherwise specified and is provided by ClearView Financial Advice Pty Ltd ABN 89 133 593 012, AFS Licence No. 331367 (ClearView) and Matrix Planning Solutions Limited ABN 45 087 470 200, AFS Licence No. 238 256 (Matrix). Any advice contained in this material is general advice only and has been prepared without taking account of any person’s objectives, financial situation or needs. Before acting on any such information, a person should consider its appropriateness, having regard to their objectives, financial situation and needs. In preparing this material, ClearView and Matrix have relied on publicly available information and sources believed to be reliable. Except as otherwise stated, the information has not been independently verified by ClearView or Matrix. While due care and attention has been exercised in the preparation of the material, ClearView and Matrix give no representation, warranty (express or implied) as to the accuracy, completeness or reliability of the information. The information in this document is also not intended to be a complete statement or summary of the industry, markets, securities or developments referred to in the material. Any opinions expressed in this material, including as to future matters, may be subject to change. Opinions as to future matters are predictive in nature and may be affected by inaccurate assumptions or by known or unknown risks and uncertainties and may differ materially from results ultimately achieved. Past performance is not an indicator of future performance.

Intergenerational Wealth: An introduction Part 1

A huge sum of wealth is acquired by beneficiaries every single year – whether in the form of inheritance after death, or via gift transfers. However, over the last few years, headlines about ‘the inheritance economy’ and ‘the big intergenerational wealth shift’ have appeared just about everywhere in developed economies.

Researchers across the globe reached the same conclusion: we are on the brink of a vast shift in assets, unlike any that we have seen before.1 Globally, worldwide demographic trends are putting in place the foundations for the largest intergenerational wealth transfer in history over the next 50 years. In Australia alone, it is expected that we will see around $3.5 trillion change hands over the next 20 years, growing at 7% per year.2

Coined as ‘the Great Wealth Transfer’ of the 21st century (GWT), it is expected to bring about a total overhaul to the way that current financial advice practices work. Is your practice ready?

Drivers behind the Great Wealth Transfer

There are a number of contributory factors that account for this large shift in money. The two main reasons are the increased net worth and changes in life expectancies.

Increased net worth: property and equity markets

In 2017, Australian household’s net wealth stood at a record $8.1 trillion.3

Growth in household net worth has historically been largely tied to property values, income and ability to save this income.

A huge proportion of this increase has been due to the rise in property prices we’ve experienced in the last 25 years. This works out at an average annual real growth rate of 4.1% p.a. above general inflation and earnings growth as shown in Figure 1.4 The beneficiaries? Baby boomers, who were able to get on the property ladder in the 1980s, and stay on it ever since.5 Indeed, the Household, Income and Labour Dynamics in Australia (HILDA) survey shows that the home is still the biggest asset, with superannuation and other property following closely behind.6 Thanks to capital growth, property can be expected to account for around 70% of the wealth transferred over the coming years. 7

Figure 1: Real property growth over time

Source: OECD

Baby boomer wealth profiles are characterised by high levels of homeownership and the rewards of the periods of economic prosperity that have occurred throughout their adult lives.

In addition to homeownership, the introduction of the Superannuation Guarantee system in 1993 has seen substantial growth in levels of superannuation holdings, which in turn has increased the amount of potentially heritable assets.8

Booming equity markets are another contributory factor to Australians’ net worth. Capegemini’s 2018 World Wealth report indicates that a growing number of individuals have hugely increased their asset bank thanks to the equity rally we have experienced over the last few years.9

Increased life expectancy

Like their net worth, the life expectancy of baby boomers has increased. Thanks to a greater awareness of healthy living practices, medical advancements and improved assisted-living facilities, our elderly are living longer. Life expectancy in Australia at age 65 has significantly grown, especially since the 1970s – from 12.2 to 19.2 years for males and from 15.9 to 22.1 years for females as shown in Figure 2.

Figure 2: Life expectancy in years in Australia at age 65

Source: Australian Government Actuary, Australian Life Tables

Living longer means that our elderly community are holding onto their assets for longer. The population aged 75 years or more is expected to rise by 4 million between 2012 and 2060, increasing from about 6.4% to 14.4% of the population.10

However, projections suggest that we will see a rising number of deaths over the next few decades. From 147,200 in 2011-12, the Australian Bureau of Statistics (ABS) expects the annual number of deaths in Australia to more than double to 352,100 in 2061 and more than triple to 545,400 in 2101.11 A significant proportion of these people is likely to transfer wealth upon death, so it is likely that we will see inheritance shift en masse.


Source: Russell Investments

1 Cutler, N.E., D, S. J. 1996 An inheritance boom for boomers? Looking beyond the headlines. Journal of Financial Service Professionals, 50(5), 4.
2 McCrindle (2016). Wealth Transfer Report, A Report for No More Practice, September. With an estimated 7.5 million children, if 70% of wealth is transferred then it is estimated approximately $326,000 on average will be passed on to each child. If this is spent, it is likely to be eroded in two years, but if managed well, it could help Gen X and Y fund their own retirements.
3 https://www.roymorgan.com/findings/7404-australian-households-net-wealth-now-over-eight-trillion-dollars-and-growing-201711092241
4 OECD Database (September 1993- June 2018)
5 Norman Morris, Roy Morgan Research November 2017
6 Johnson, D (2017) Australia’s hidden treasure: The immense potential of baby boomer housing equity in averting a retirement cashflow crisis. PhD thesis. Griffith University
7 Template, J., McDonald, P.Rice, J. Net assets available at age of death in Australia. Population Review Volume 56, Number 2, 2017., Sociology Demography Press.
8 The 2015 Intergenerational Report; Australia in 2055 predicted that superannuation assets alone could rise to $9 trillion by 2040 (Treasury, 2015).
9 CapeGemini, ‘World Wealth Report 2018’, p.16.
10 Productivity Commission, 2013. An Ageing Australia: Preparing for the Future,
11 ABS 3222.0 – Population Projections, Australia, 2012 (base) to 2101 released Nov 2013


Advice clients are 5.2% a year better off

This article first appeared in the Financial Review and the IFA Magazine.

Advisers generate an average 5.2 per cent extra cash per year for clients regardless of market movements, through services such as asset allocation and behavioural coaching, new research has revealed.

Russell Investments’ Value of an Adviser Report sought to quantify the value delivered by advisers in five service areas beyond investment advice – asset allocation, correcting behavioural mistakes, adequately managing clients’ cash holdings, setting and monitoring goals and tax structuring.

The report found that advisers generated an average 2.2 per cent per year for clients through ensuring they bought and sold assets at the correct times in the market cycle, and 1.5 per cent through ensuring investments were made in tax efficient structures such as super and transition to retirement.

A further 0.9 per cent was generated through asset allocation basics such as selecting the correct investment option in the client’s super fund, and 0.6 per cent by diversifying a client’s cash and fixed income holdings.

Russell Investments head of wholesale partnerships Neil Rogan said the research highlighted the concrete difference advice could make even through relatively simple services such as acting as a sounding board for investment decisions.

“If you look at it, it’s around 3.1 per cent just through asset allocation and the adviser coaching the client on behaviours around when they should or shouldn’t sell,” Mr Rogan said.

“An important role that the adviser plays, not only is getting the allocation right but also really saving the client from themselves.

“When you look at the difference [in outcomes] over 20 years, I think that’s a really important point, and now more than ever that behavioural piece is important when advisers are working with clients, with these turbulent markets.”

Mr Rogan said being able to quantify the value of advice, which was often talked about in general terms in the industry, would help advisers to confidently articulate and charge fair up-front fees to clients.

“If you look at the fee piece, would you pay $3,000 to make $10,000? I think the answer to that is clearly yes – it’s a no-brainer, so why wouldn’t you get advice?” he said.

While the fifth non-investment service – setting and monitoring goals – was not specifically quantified in the report, Mr Rogan said this could often be the key piece of the puzzle when it came to delivering value for clients.

“It’s actually understanding what your client needs and wants to do, and putting in place strategies to help them do it,” he said.

“You can dress that up as goals-based advice, but it’s about the expertise and understanding the client’s behaviours and matching the asset allocation, investments and the tax strategies that fit around it.”

Source: IFA


Market Review September 2020

Monthly Market Review – September 2020

VIEW PDF

How the different asset classes have fared: (As at 30 September 2020)

1 Bloomberg AusBond Bank 0+Y TR AUD, 2 Bloomberg AusBond Composite 0+Y TR AUD, 3 Bloomberg Barclays Global Aggregate TR Hdg AUD, 4 S&P/ASX All Ordinaries TR, 5 Vanguard International Shares Index, 6 Vanguard Intl Shares Index Hdg AUD TR, 7 Vanguard Emerging Markets Shares Index, 8 FTSE Developed Core Infrastructure 50/50 NR AUD, 9 S&P/ASX 300 AREIT TR, 10 FTSE EPRA/NAREIT Global REITs NR AUD

Australian Dollar and Australian Shares

The Australian dollar fell during September as risk sentiment deteriorated and investors speculated that the Reserve Bank of Australia will further reduce interest rates from 0.25% to 0.1% at its next meeting in early October. The dollar rose slightly as a rally in local and international share markets at the end of the month signaled improving risk sentiment but still finished the quarter down by almost 3%. Australian shares also ended the month lower as a new bout of volatility raised questions about high valuations in IT and consumer discretionary stocks. The prolonged economic shutdown pulled down valuations in commercial real estate.

International Shares and infrastructure

International shares finished the month lower as investor sentiment turned negative with technology stocks dragging down the overall market. The month saw brief rallies following reports of progress on a COVID-19 vaccine. However, concerns about the November election in the US and an increase in European COVID-19 cases weighted heavily on investor sentiment.

Valuations in Europe continue to remain more attractive on a price-to-earnings basis than in the United States but repeated waves of COVID-19 and a poor outlook for the region’s banking system has meant that the regional index has struggled to rise. Japan continued to rally, albeit at a slower pace than in August as the country brought its second wave under control and attractive valuations drew in investment. US shares were more volatile than in July and August as high valuations, particularly in the technology sector, led to volatility.

Emerging Markets

Emerging markets rallied in September given attractive valuations relative to developed market equities. There are headwinds for EM with ongoing US efforts to prevent Chinese companies from accessing the US marketplace which will continue to weigh on sentiment. An end to the sell-off in the US dollar may cause more pain for EM companies and households making purchases of imported goods.

Fixed income

Australian fixed income rallied in September as speculation that the Reserve Bank of Australia will announce further easing at its October meeting placed downward pressure on yields. International fixed-income investors were also helped by central banks. In the US, yields fell as the Federal Reserve signaled it plans to maintain near-zero interest rates until 2023.

Disclaimer

The information contained in this material is current as at date of publication unless otherwise specified and is provided by ClearView Financial Advice Pty Ltd ABN 89 133 593 012, AFS Licence No. 331367 (ClearView) and Matrix Planning Solutions Limited ABN 45 087 470 200, AFS Licence No. 238 256 (Matrix). Any advice contained in this material is general advice only and has been prepared without taking account of any person’s objectives, financial situation or needs. Before acting on any such information, a person should consider its appropriateness, having regard to their objectives, financial situation and needs. In preparing this material, ClearView and Matrix have relied on publicly available information and sources believed to be reliable. Except as otherwise stated, the information has not been independently verified by ClearView or Matrix. While due care and attention has been exercised in the preparation of the material, ClearView and Matrix give no representation, warranty (express or implied) as to the accuracy, completeness or reliability of the information. The information in this document is also not intended to be a complete statement or summary of the industry, markets, securities or developments referred to in the material. Any opinions expressed in this material, including as to future matters, may be subject to change. Opinions as to future matters are predictive in nature and may be affected by inaccurate assumptions or by known or unknown risks and uncertainties and may differ materially from results ultimately achieved. Past performance is not an indicator of future performance.

Life cover: More essential than ever

Life cover. More essential than ever

Living through COVID-19 has brought many challenges and shifting priorities as we deal with the financial impacts of the pandemic, and that includes the issue of life insurance. 

On the one hand, the pandemic has highlighted the importance of life cover. On the other, those who may have lost a job or lost income are questioning its necessity.

Many Australians continue to view life insurance as a discretionary item. This is in stark contrast to the car or home insurance which are seen as necessities. It seems we are willing to insure our property but not the thing that matters most – our life and our ability to earn an income.

Conflicting priorities

survey by KPMG found that only 35 per cent of Australians thought life insurance was essential and just 30 per cent believed they needed income protection. But when it comes to car insurance, 79 per cent viewed cover as essential and yet, during COVID-19, car usage reduced as many were working from home and restricting their movements.

As the COVID-19 health crisis has reinforced our vulnerability in terms of health and the fragility of life, the need for life and income protection insurance has probably never been greater.

What would happen if you became too sick to return to work or if you passed away? Who would pay the mortgage, living costs, health insurance and utility bills for you or the family you left behind? For those with outstanding debt and dependants, life insurance will always be an important consideration.

It should also be remembered that the current health crisis does not rule out people getting sick with other illnesses, some linked to COVID-19 and some not. Mental health is one of these health issues and is becoming increasingly prevalent.

Claims on the rise

In the June quarter, the life insurance industry reported a net after-tax loss of $179 million on its individual income protection products, driven largely by claims for mental health issues in the wake of COVID-19.i Mental health claims are expected to grow even further as it is thought most people take more than a year to report such issues.

With claims on the uptick, this has meant the insurance industry is either looking to increase premiums or already has. This, in turn, may discourage people from keeping their cover.

Indeed, the KPMG survey said that 38 per cent of policyholders were looking to cancel their income protection insurance in the next 12 months, and 25 per cent were planning to drop life cover.

On the plus side, many Australians have some level of life and income protection insurance in their super. However, if you were to lose your job, then paying premiums on your insurance in super would come out of your fund balance, reducing your retirement savings over time.

Also, your insurance might well cease when you lose your job unless you opt to take out a private policy. You generally have 60 days to take up this option.

Redundancy payments

If your income protection insurance is outside super, then be mindful that not all policies include redundancy claims. And those that do may have restrictions. For instance, there is usually a waiting period of up to 28 days before any payments will be made.

If you are thinking of taking out a policy now to cover you in case of redundancy given the current economic environment, then you will probably have to go through a six-month no-claim period before you can benefit. During that six-month period, there must be no indication from your employer that redundancy may be on the cards.

Many insurance companies recognise the financial and personal difficulties many people currently face and some have offered to reduce or even suspend premiums without any loss of continuity to your policy.

One alternative may be to look at reducing the cover you have so that your premiums reduce. But it’s important to be mindful of your needs and ensure you have adequate cover.

The road ahead

The insurance industry, like many others, is being forced to look at a different way of doing business in a post-COVID-19 world, with simpler policies and flat premiums all being discussed.

In the meantime, making quick decisions on whether you still need insurance or your current level of insurance, may prove a mistake. If you are thinking about altering your cover, give us a call first to discuss your insurance needs.

https://www.fsc.org.au/news/income-protection

In a world full of choices,
this is why our clients chose us:

Over the years, we have come to rely on Sherlock Wealth to take care of all our financial affairs and to see Andrew as

Dr. Bruce Walker

Read more

I have been a client of the Sherlocks for more than 40 years. The sound advice I have received from Andrew in relation to building wealth

Mark Worrall

Read more

We wanted to express our enormous thanks to you and your team. First of all for your sage advice in terms of the

Trauma Claim

Read more

Since becoming a Sherlock Wealth client, my wife Jacinta and I have never felt more than in control of our

Rob and Jacinta Jones

Read more

Having busy lives, we truly value the advice and care that Andrew and the team at Sherlock Wealth provide with

Rachel and Brett Lunn

Read more

I would say to anyone that you have to prioritise your financial affairs as an important part of your life

Jo Masters

Read more

Want to know more?
Sign up to our e-news today!

    YOUR SUCCESS IS OUR PASSION +612 8247 9900